
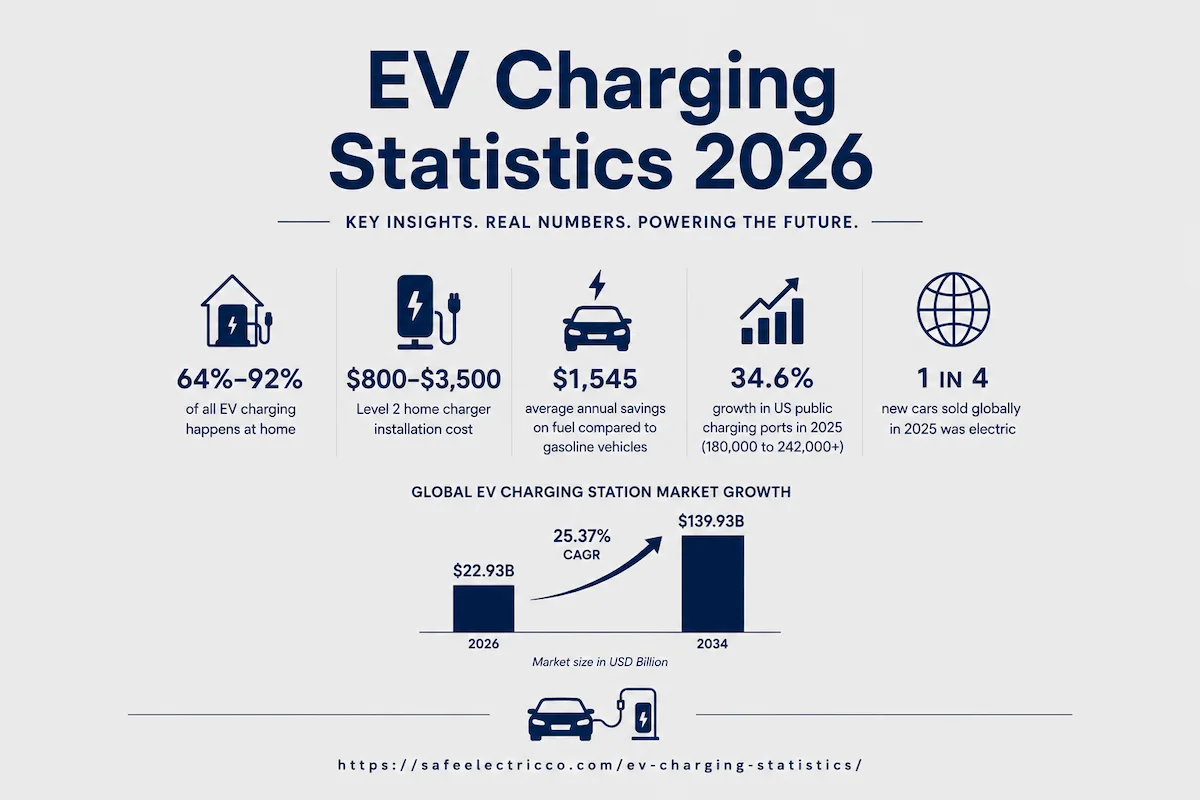
EV charging statistics reveal a transformation happening at unprecedented speed: the global EV charging station market surged from $18.16 billion in 2025 to $22.93 billion in 2026, growing at a staggering 25.37% CAGR toward $139.93 billion by 2034.
Scroll down to explore the latest EV charging trends, cost benchmarks, infrastructure data, market growth projections, and key insights shaping the electric vehicle charging market in 2026 and beyond.
Summary
Here is a summary of the most important EV charging statistics for 2026:
- The global EV charging station market is valued at $22.93 billion in 2026, growing at 25.37% CAGR to reach $139.93 billion by 2034.
- The US public charging network grew 34.6% in 2025, from 180,000 to over 242,000 public ports, surpassing 250,000 total ports by mid 2026.
- The US needs 28 million charging ports by 2030 to support 33 million EVs. Today there are roughly 4 million.
- 64% to 92% of all EV charging happens at home, making residential Level 2 installation the largest market segment.
- A Level 2 home charger installation costs $800 to $3,500 total, with the national average around $1,400.
- Home charging costs approximately $10.50 for a full charge (60 kWh) at the US average rate of 17.65 cents per kWh.
- EV drivers save $1,545 per year on fuel ($675 EV vs $2,220 gas) and 31% to 50% on maintenance.
- One in four new cars sold globally in 2025 was electric, with almost 80 million EVs now on the road worldwide.
- US EV market share was 7.4% of new registrations in 2025, with 1.57 million EVs sold in 2024.
- Actual EV charging success rate is 71%, despite networks claiming 98% to 99% uptime. Nearly 1 in 3 attempts fail.
- Tesla leads DC fast charging with 8,704 stations and 82,357 stalls globally (Q2 2026), followed by Electrify America (7.9%) and ChargePoint (6.9%).
- The $7.5 billion NEVI federal program has allocated $2.4 billion to states, with revised guidance expanding eligible uses but facing budget uncertainty.
Our Expert Analysis
Home Charging Is the Real Market: With 64% to 92% of all charging happening at home and 25.7 million private chargers needed by 2030, the residential Level 2 installation market dwarfs public charging. At $1,000 to $3,500 per installation, this represents a $25 billion to $90 billion opportunity for electricians over the next five years. Public charging gets the headlines, but home charging is where the volume and revenue are.
The Reliability Gap Is the Industry’s Biggest Problem: The chasm between claimed uptime (98% to 99%) and actual success rate (71%) is not a technical issue. It is a maintenance, accountability, and metrics issue. Until the industry shifts from uptime reporting to success rate reporting, driver frustration will continue to slow adoption. California’s 97% uptime standard in grant requirements is the model other states should follow.
Market Scope Explains Valuation Gaps: The range from $22.93B to $73.92B reflects fundamentally different definitions. Narrow definitions cover charging station hardware and network services. Broad definitions include installation, software, grid upgrades, and related equipment. Regardless of starting point, all sources agree on 17% to 26% CAGR, confirming hyper growth.
The 28 Million Port Gap Is Both Crisis and Opportunity: The US needs 28 million ports by 2030 but has roughly 4 million today. This 7x gap in four years is the defining challenge of the EV transition. It is also the defining opportunity for the electrical contracting industry, which will need to scale installation capacity by an order of magnitude.
Federal Funding Uncertainty Creates State Level Variation: With $2.4 billion allocated but budget uncertainty looming, states that move quickly on NEVI funding will build infrastructure advantages. States that wait risk falling behind in EV adoption, property values, and economic development. The revised NEVI guidance expanding eligible uses is a positive signal, but execution speed matters more than policy language.
Tesla’s Network Effect Is Structural: With 8,704 stations, 82,357 stalls, and record 1.8 TWh quarterly energy delivery, Tesla’s Supercharger network creates a self reinforcing adoption loop. The opening of the network to non Tesla vehicles (NACS standard) further entrenches this advantage. Competitors must differentiate on reliability, pricing, and location convenience rather than scale.
The Economics Are Now Overwhelming: At $675 per year for EV fuel versus $2,220 for gasoline, with 31% to 50% maintenance savings on top, the total cost of ownership advantage is clear. The $5,800 purchase price premium is recovered in 3 to 4 years. Every year of delay costs the average driver $1,545 in unnecessary fuel and maintenance expenses.
1. Global EV Charging Market Size and Growth
The EV charging industry is experiencing explosive growth driven by accelerating EV adoption, government mandates, corporate sustainability commitments, and the fundamental economics of electricity versus gasoline.
Homeowners, businesses, municipalities, and fleet operators are investing in EV charging infrastructure at a pace that is reshaping the global energy landscape. The EV charging data clearly shows a market in hyper growth.
Global EV Charging Station Market: The global electric vehicle charging station market size was USD 57.34 billion in 2025 and is expected to grow from USD 73.92 billion in 2026. Source: Precedence Research
Global EV Charging Infrastructure: The electric vehicle charging infrastructure market size was valued at $40.2 billion in 2025, projected to grow from $50.3 billion in 2026 to $238.8 billion by 2033, at a CAGR of 25.0%. Source: Grand View Research
Global EV Charging Stations: The market is projected to grow from USD 22.93 billion in 2026 to USD 139.93 billion by 2034, exhibiting a CAGR of 25.37%. Source: Fortune Business Insights
Global EV Charging Station: Global Electric Vehicle Charging Station Market size was valued at $56.3 billion in 2026 and it will grow to $318.03 billion at a CAGR of 21.2% by 2035. Source: Custom Market Insights
Global EV Charging Station: The electric vehicle charging station market was estimated at USD 50.7 billion in 2025 and is expected to grow at a CAGR of 23.8% between 2026 and 2035. Source: GM Insights
EV Charging Station: The EV charging station market is set to surge from US$37.4 billion in 2026 to US$137.3 billion by 2033, registering a strong 20.3% CAGR. Source: Persistence Market Research
EV Charging Infrastructure CAGR: The global electric vehicle charging infrastructure market is poised to grow at a CAGR of 26.32% from 2026 to 2035. Source: Precedence Research
US EV Charging Stations Market: The U.S. electric vehicle charging stations market was valued at USD 5.2 billion in 2024, advancing at a CAGR of 29.5% during 2025 to 2032. Source: P&S Market Research
EV Charging Infrastructure Revenues: EV charging infrastructure revenues reached USD 32.2 billion in 2024, escalating to USD 41.0 billion in 2025, with revenues expected to reach USD 52.3 billion in 2026. Source: Scoop Market
EV Charging Cable Market: The Global EV Charging Cable Market is projected to expand from USD 1.54 billion in 2025 to USD 3.73 billion by 2031. Source: Yahoo Finance
2. US and Global EV Charging Infrastructure Data
Understanding the scale and growth of EV charging infrastructure is fundamental to evaluating market opportunity, installation demand, and network reliability. These EV charging statistics provide the infrastructure benchmarks homeowners, businesses, and electricians need.
The data shows that while public charging is growing rapidly, the overwhelming majority of EV charging happens at home, making residential Level 2 installation the single largest segment of the industry.
Global Private Charging Points: Globally, the number of private light duty vehicle charging points is estimated to have reached more than 43 million in 2025. Source: IEA Global EV Outlook 2026
US Public Charging Ports: For the first time, charging infrastructure has kept pace, rising by 34.6%, from 180,000 to over 242,000 public ports. Source: Zutobi / Aftermarket Matters
US DC Fast Chargers: DC fast chargers in the U.S. are up 35% year over year, with more than 228,000 charging ports now available at roughly 76,000 locations. Source: Clean Air Choice
US Public Stations: U.S. public EV charging stations reached approximately 78,800 by January 2026, with DC fast ports totaling approximately 68,000. Source: SmartKarma
US DC Fast Ports: As of June 2026, there were 73,951 public DC fast charging ports across the US, with the network surpassing 250,000 total charging ports. Source: EV Infrastructure News
US Charging Ports Needed by 2030: By 2030, the U.S. will need 28 million EV charging ports to support 33 million EVs on the road. Source: DOE EVGrid Assist
Private Home Charging Dominance: Of the 28 million charging ports needed, 25.7 million (92%) are expected to be private Level 1 and Level 2 chargers at single family homes. Source: DOE EVGrid Assist
US Charge Points Projection: The number of charge points in the US is forecast to rise from about 4 million currently to 35 million in 2030. Source: PwC
Home Charging Share: The majority (64%) of EV charging is estimated to take place at single family homes using L1 and L2 charging. Source: DOE EVGrid Assist
Private Charging Behavior: EV owners charge privately (at home or a workplace) almost 75% of the time, and charge at public fast chargers only 10% of the time. Source: IEA Global EV Outlook 2026
Home Charging Rate: Nearly 9 in 10 EV drivers charge at home, while more than 60% still rely on public chargers each week. Source: FinanceBuzz
Fast Charger Market Share: In 2026, fast chargers are projected to hold 51.7% of the global EV charging station market by share, up from a clear minority position three years ago. Source: Uniz Solar
At Work Charging Growth: The fastest growing charging segment is expected to be the at work segment, set to grow from nearly zero percent of the entire market to about 17% by 2030. Source: PwC
New York Growth: New York saw a remarkable 72.08% increase in charging infrastructure over the past year. Source: Zutobi
3. EV Charging Cost and Installation Data
One of the most common questions homeowners and businesses ask is how much EV charging will cost, both for installation and ongoing electricity. The EV charging cost data below provides clear benchmarks for charger pricing, installation costs, and per mile fuel costs.
From a $300 Level 2 charger unit to a $3,500 full installation with panel upgrade, options exist at every budget level. The key is matching charger amperage to your electrical capacity, driving habits, and vehicle battery size.
Level 2 Installation Total: A typical Level 2 EV charger installation costs between $800 and $3,000 all in, including the charger hardware, electrician labor, wiring, and permits. Source: SimpleSwitch
Level 2 Installation Range: In many U.S. homes, Level 2 charger installation cost typically falls between $800 and $3,000 for installation work before equipment. Source: EcoFlow
Installation Only: Generally, you can expect installation costs to range from $1,000 to $3,000, excluding the price of the home charging station. Source: FLO
Level 2 Installation: Level 2 charger installations typically cost between $1,500 to $2,750, depending on labor costs, needed permits, and the charger you choose. Source: Treehouse
Total Install: Home EV charger installation typically costs $1,200 to $2,500 total, including a $400 to $800 charger and $300 to $1,500 for installation labor. Source: ElectrifyHome
Total Install: Installing a Level 2 EV charger at home costs $1,000 to $3,500 total, including the charger unit ($400 to $800) and professional electrical installation ($400 to $2,500). Source: The Garage Guide
DOE Average Estimate: The estimated average cost to install chargers and outlets for Level 2 EV charging for a single family house is $1,400. Source: US DOT
Home Charger Unit Cost: On average, the home charger costs start at $500. Source: JD Power
Level 2 Charger Unit Range: Level 2 charger units range from $300 to $800 USD depending on brand and power output. Source: Elink Power
US Average Electricity Rate: The US average electricity rate is 17.65 cents per kWh as of 2026. Source: KBB
Home Charging Full Charge (60 kWh): A typical EV with a 60 kWh battery costs about $10.50 for a full charge at home. Source: ElectricChoice
Home Charging Full Charge (72 kWh): Home EV charging costs $13 for a 72 kWh battery at $0.18/kWh, translating to about $0.05 per mile. Source: Qmerit
Home Charging Annual Cost: Annual home charging costs approximately $694 for 13,489 miles of driving. Source: Qmerit
Home Charging Monthly Cost: For a driver covering 1,200 miles per month, home charging adds roughly $68 per month. Source: NRG Clean Power
Home Charging Monthly Spend: The average amount of money that owners say they spent on EV home charging in the past 30 days has increased to $63, up $5 from a year ago. Source: JD Power 2026 EVX Study
Public DC Fast Charging Cost: The average cost of public DC fast charging is 36.5 cents per kWh, more than double the cost of charging at home. Source: CNET
Public DCFC Average Price: The average estimated cost for Level 3 DCFC prices increased 9% on average to $0.47 per kWh. Source: Stable Auto
EV Annual Fuel Cost: EVs cost approximately $675 per year in fuel versus $2,220 for gasoline vehicles, saving $1,545 annually. Source: MotorWatt
EV Per Mile Savings: U.S. electric vehicle drivers saved an average of 8.3 cents per mile on fuel and maintenance compared with gas cars in Q4 2025, with fuel savings alone averaging 5.3 cents per mile. Source: Coltura
EV Maintenance Savings: EVs save 31% to 50% on maintenance costs compared to gasoline vehicles. Source: MotorWatt
4. EV Charging Speed, Levels, and Performance Data
Understanding the three levels of EV charging and their respective speeds is fundamental to choosing the right charger for your needs. These EV charging statistics provide the performance benchmarks drivers and installers need to match charger capacity to vehicle and lifestyle requirements.
Level 1 Charging Speed: Level 1 chargers use a standard 120V household outlet and can deliver 3 to 5 miles of range per hour of charging, taking 40 to 50+ hours for a full charge. Source: US DOT
Level 2 Charging Speed: Level 2 chargers use a 240V circuit and can deliver 10 to 75 miles of range per hour, charging a BEV to 80% from empty in 4 to 10 hours. Source: US DOT
Level 2 Range Per Hour: Level 2 charging adds approximately 25 to 40 miles of range per hour and is the best home charging option. Source: GetNeoCharge
DC Fast Charging Speed: DC fast chargers can deliver 60+ miles of range per hour, with a full charge taking 30 minutes to 1.5 hours. Source: Ford
DC Fast 10 to 80% Time: DC fast charging 10% to 80% takes around 18 minutes for a 2026 IONIQ 5 (84 kWh battery). Source: KBB
Level 2 vs DC Fast Full Charge: Level 2 chargers take up to ten hours to a full charge, where DC fast chargers take 30 minutes to 1.5 hours. Source: Sona Energy
Level 2 Power Output: Level 2 charging uses 208 to 240V in North America with 3 to 22 kW output, adding 10 to 75 miles of range per hour. Source: Power Sonic
5. EV Sales, Ownership, and Adoption Data
Understanding EV adoption rates is essential for evaluating charging infrastructure demand. These EV charging insights connect vehicle sales data to charging needs, showing why infrastructure investment must accelerate to keep pace with adoption.
Global EV Sales: Global EV sales reached 21.6 million in 2025 and are forecast at 22.7 million in 2026, with share rising to 24.7%. Source: EV Volumes
Global EV Sales Growth: Electric car sales grew by 20% globally to exceed 20 million in 2025, meaning one quarter of all new cars sold were electric. Source: IEA Global EV Outlook 2026
Norway EV Adoption: In Norway, almost all new cars sold (97% of them) were electric in 2025. Source: Our World in Data
US EV Market Share: U.S. EV market share fell to 5.7% in Q4 2025, with 234,171 fully electric vehicles sold in the fourth quarter. Source: CarEdge
US EV Registrations: Nationally, 7.4% of all new passenger car and light truck registrations in 2025 were for electric vehicles. Source: Edmunds
US EV Sales: From 2011 to 2024, total EV sales in the U.S. increased from 17,763 to 1,569,430, with an average year over year increase of 49 percent. Source: AutoInsurance.com
US EVs on Road by 2030: PwC projects an estimated 27 million EVs on the road by 2030 in the United States. Source: PwC
US EVs on Road by 2035: EEI forecasts nearly 12.2 million annual EV sales in 2035, resulting in more than 78 million total EVs on U.S. roads. Source: EEI
US EV Market Revenue: The Electric Vehicles market in the United States is projected to reach a revenue of US$113.1 billion in 2026. Source: Statista
EV Annual Mileage: Gasoline vehicles averaged 13,323 miles annually, while EVs averaged 11,880 miles. Source: Seeking Alpha
6. EV Charging Reliability and Network Data
Charging reliability is the single most important factor affecting EV driver satisfaction and adoption. These EV charging statistics reveal a significant gap between reported uptime and actual charging success rates.
The data shows that while the industry is improving, nearly one in three charging attempts still fail, creating frustration that slows adoption and undermines confidence in EV infrastructure.
US Reliability Score: The US average reliability score was 93.5 in Q1 2026, up from 93.4 in Q4 2025, with most states now falling in the 90 to 95% range. Source: Paren
Actual Success Rate: While networks claim an uptime of 98% to 99%, US research from ChargerHelp found that the actual first time charging success rate is 71%. Source: Zest / ChargerHelp
Charging Attempt Failures: 71% of charging attempts are successful, meaning 35% of failures occur on chargers that appear operational. Source: ChargerHelp 2025 Annual Report
New Station Reliability: New stations start at 85% success rate but drop over time as maintenance is deferred. Source: ChargerHelp
US Reliability Index: In Q1 2025, the US Reliability Index saw a significant improvement versus Q4 2024 of 1.4 points to 82.6, an increase of 1.7%. Source: EVCandi
Failure Rate: Nearly 1 in 3 EV charging attempts fail, urging a shift toward reliability metrics that reflect real driver experience. Source: Clean Trucking
California Uptime Standard: The CEC has included reliability requirements in EV charging grants since 2021, which set 97 percent uptime standards. Source: California Energy Commission
EVSP Reported Uptime: While EV service providers often report an uptime of 95% to 98%, independent studies show lower actual performance. Source: SCS Coatings
Tesla Supercharger Network: Tesla closed Q2 2026 with 8,704 DC fast charging stations and 82,357 stalls globally. Source: EVChargingStations
Tesla Supercharger Growth: Tesla Supercharger network hit record 1.8 TWh in Q1 2026, adding 2,500 stalls with a 26% surge in charging sessions. Source: EVWire
Tesla US Locations: Tesla now has more than 3,000 Supercharging locations in the United States, with the network expanding by roughly 20% since the beginning of 2025. Source: EV Charging Station Reviews
DC Fast Market Share: In terms of overall market share for DC fast charging ports, Tesla leads, followed by Electrify America (7.9%) and ChargePoint (6.9%). Source: InsideEVs
ChargePoint DC Fast Ports: ChargePoint has 4,249 DC fast ports (7.6% share), now ahead of EVgo at 4,083 ports (7.3% share). Source: EVChargingStations
ChargePoint Sessions: ChargePoint reports record global public charging demand across its network, with 2025 sessions exceeding 100 million. Source: EV Charging Station Reviews
7. Federal Funding, NEVI Program, and Policy Data
Government policy and federal funding play a critical role in EV charging infrastructure deployment. These EV charging insights track the status of the $7.5 billion NEVI program and related policy developments.
NEVI Total Allocation: The IIJA allocates a combined $7.5 billion over five years (FY2022 to FY2026) for the National Electric Vehicle Infrastructure (NEVI) Formula Program, including $5 billion for nationwide funding and $2.5 billion for corridor and community charging grants. Source: Congress.gov
NEVI Formula Program: The Infrastructure Investment and Jobs Act of 2021 established the $5 billion National Electric Vehicle Infrastructure (NEVI) Formula Program. Source: Landline Media
NEVI Funding Allocated: Roughly $2.4 billion was allocated to states for fiscal years 2022, 2023, and 2024 of the NEVI program. Source: GovTech
NEVI Cost Share: Funding is available for up to 80% of eligible project costs, including the acquisition, installation, and network connection of EV chargers. Source: AFDC
NEVI Revised Guidance: President Trump’s Transportation Secretary Sean P. Duffy unveiled revised NEVI guidance to allow states to actually build EV chargers, expanding eligible funding uses. Source: US DOT
NEVI Budget Uncertainty: The NEVI program faces potential cuts in the budget bill, creating uncertainty for state level deployment planning. Source: Inside Climate News
NEVI Updated Guidance: Under the new guidance, states have expanded eligible funding uses, including MHD charging infrastructure and upgrades to existing stations. Source: Electrification Coalition
8. EV Charging Insights for Homeowners, Businesses, and Electricians
Consumer behavior data reveals important patterns in how EV owners charge, what they spend, and what barriers remain to adoption. These EV charging insights help electricians, businesses, and policymakers understand the market opportunity.
Home Charging Dominance: 64% of all EV charging takes place at single family homes, making residential Level 2 installation the single largest segment of the EV charging industry. Source: DOE
Home Charger Monthly Spend: The average EV owner spends $63 per month on home charging in 2026, up $5 from the previous year. Source: JD Power
EV Total Cost of Ownership: Today, electric cars often have a lower total cost of ownership than ICE cars over the vehicle lifetime, due to reduced fuel and maintenance expenses. Source: IEA
EV vs Gas Annual Fuel: EVs cost approximately $675 per year in fuel versus $2,220 for gasoline vehicles, a savings of $1,545 annually. Source: MotorWatt
EV Purchase Price Premium: The average EV costs $55,544 versus $49,740 for gas cars, a premium of approximately $5,800 that is recovered through fuel and maintenance savings within 3 to 4 years. Source: MotorWatt
EV Per Mile Savings: EV drivers save 8.3 cents per mile on fuel and maintenance combined, with fuel savings alone at 5.3 cents per mile. Source: Coltura
Charging Infrastructure Keeping Pace: For the first time in 2025, US charging infrastructure growth (34.6%) kept pace with EV adoption, signaling a maturing market. Source: Zutobi
US EV Sales Growth: From 2011 to 2024, total EV sales in the U.S. increased from 17,763 to 1,569,430, with an average year over year increase of 49 percent. Source: AutoInsurance.com
Public Charging Reliance: While nearly 9 in 10 EV drivers charge at home, more than 60% still rely on public chargers each week, indicating that both home and public infrastructure are essential. Source: FinanceBuzz
EV Charging as Electrical Opportunity: With 25.7 million private home chargers needed by 2030 and Level 2 installations costing $1,000 to $3,500 each, the residential EV charging installation market represents a $25 billion to $90 billion opportunity for licensed electricians over the next five years. Source: DOE / Industry Analysis
The Future of EV Charging
The EV charging industry is transforming from an emerging technology into essential transportation infrastructure. With $22.93 billion in global market revenue growing at 25%+ CAGR, one in four new cars sold globally being electric, and the US needing 28 million charging ports by 2030, the economic case for EV charging investment has never been stronger.
The data clearly shows that markets are growing at 17% to 26% CAGR depending on scope, home charging represents 64% to 92% of all charging activity, and the residential Level 2 installation market is the single largest opportunity for electricians.
Property owners who invest in quality EV charging infrastructure today position themselves for decades of fuel savings, increased property values, and compliance with emerging building codes.
Electricians and electrical contractors who position themselves as EV charging specialists rather than general service providers will capture the premium segment of this expanding market.
The combination of 49% average annual EV sales growth, $1,000 to $3,500 per installation, and 25.7 million home chargers needed by 2030 creates a multi decade growth runway for the electrical industry.
As EV adoption accelerates and charging reliability improves from 71% toward the 97% standard, EV charging will shift from early adopter technology to universal home and building infrastructure.
Now is the time to leverage these EV charging statistics to inform your installation planning, business strategy, and long term electrical infrastructure decisions.
FAQs
How much does it cost to install a Level 2 EV charger at home in 2026?
A typical Level 2 EV charger installation costs $800 to $3,500 total in 2026, including the charger unit ($300 to $800) and professional electrical installation ($400 to $2,500). The DOE estimates the average single family home installation at $1,400. Costs increase if a panel upgrade is needed ($1,500 to $4,000 additional) or if the charger is far from the electrical panel.
How much does it cost to charge an EV at home?
At the US average electricity rate of 17.65 cents per kWh, a full charge for a 60 kWh battery costs approximately $10.50. For a 72 kWh battery, it costs about $13. This translates to approximately $0.05 per mile, or about $694 per year for 13,489 miles of driving. The average EV owner spends $63 per month on home charging according to JD Power’s 2026 study.
How much does public EV charging cost?
Public DC fast charging costs 36.5 to 47 cents per kWh on average, more than double the cost of home charging. A full charge at a DC fast charger costs approximately $22 to $28 for a 60 kWh battery. Public Level 2 charging is cheaper but still more expensive than home rates. Prices vary significantly by network, location, and time of day.
How long does it take to charge an EV?
Level 1 (120V) adds 3 to 5 miles of range per hour, taking 40 to 50+ hours for a full charge. Level 2 (240V) adds 10 to 75 miles per hour, charging to 80% in 4 to 10 hours. DC fast charging adds 60+ miles per hour, reaching 10% to 80% in approximately 18 to 30 minutes for most modern EVs.
How many EV charging stations are in the US?
As of mid 2026, the US has over 250,000 public charging ports at approximately 78,800 stations. This includes 73,951 DC fast charging ports. The network grew 34.6% in 2025, from 180,000 to over 242,000 ports. The US needs 28 million total ports (including private home chargers) by 2030 to support projected EV adoption.
What percentage of EV charging happens at home?
Approximately 64% to 75% of all EV charging takes place at home or at work, according to DOE and IEA data. Nearly 9 in 10 EV drivers charge at home. Public DC fast chargers account for only about 10% of total charging activity. This makes home Level 2 installation the most important charging investment for most EV owners.
How reliable are public EV chargers?
Actual first time charging success rates are approximately 71% according to ChargerHelp’s 2025 Annual Reliability Report, despite networks claiming 98% to 99% uptime. Nearly 1 in 3 charging attempts fail, with 35% of failures occurring on chargers that appear operational. The US reliability score improved to 93.5 in Q1 2026, but the gap between claimed and actual performance remains significant.
How much money does an EV save versus gasoline?
EV drivers save approximately $1,545 per year on fuel ($675 EV versus $2,220 gasoline) and an additional 31% to 50% on maintenance costs. Per mile savings average 8.3 cents on fuel and maintenance combined. Over a five year ownership period, total savings can reach $10,000 to $15,000 depending on driving habits and local electricity rates.
What is the NEVI program and how much funding is available?
The National Electric Vehicle Infrastructure (NEVI) Formula Program allocates $7.5 billion over five years (FY2022 to FY2026), including $5 billion in formula funding to states and $2.5 billion in discretionary grants. Approximately $2.4 billion has been allocated to states for FY2022 to FY2024. Funding covers up to 80% of eligible project costs. The program faces budget uncertainty but revised guidance has expanded eligible uses.
Which EV charging network is the largest?
Tesla operates the largest DC fast charging network with 8,704 stations and 82,357 stalls globally as of Q2 2026, including over 3,000 locations in the US. Among non Tesla networks, Electrify America holds 7.9% of US DC fast port share, followed by ChargePoint (7.6%, 4,249 ports) and EVgo (7.3%, 4,083 ports). ChargePoint reported over 100 million charging sessions in 2025.
Do I need to upgrade my electrical panel for a Level 2 charger?
Not always. If your home has a 200 amp panel with available capacity and a nearby 240V circuit, installation may cost as little as $800 to $1,500. However, older homes with 100 amp panels or limited capacity may need a panel upgrade ($1,500 to $4,000) or a dedicated circuit run ($500 to $1,500). A licensed electrician should assess your panel before purchase.
How fast is the EV charging market growing?
The global EV charging station market is growing at 17.7% to 25.37% CAGR depending on the research firm and scope definition. The US market is growing even faster at 29.5% CAGR. Global EV sales grew 20% in 2025 to exceed 20 million units, with one in four new cars sold being electric. The US charging network grew 34.6% in 2025, the first year infrastructure growth kept pace with vehicle adoption.